Coyotera
The orchard, lot by lot
ZONES · WHITE OUTLINE
What each lot needs
Canopy decides first: a lot at ≥ 70 % cover is consolidated. Below that, grid fill separates "needs time" (≥ 80 % of the 8 × 8 m grid) from "needs trees".
TREESSIMULATED
The cover × grid-fill quadrant separates two lots that look alike from the road but need opposite things: one is missing trees, the other only needs time.
Where each lot sits
This season
All lots
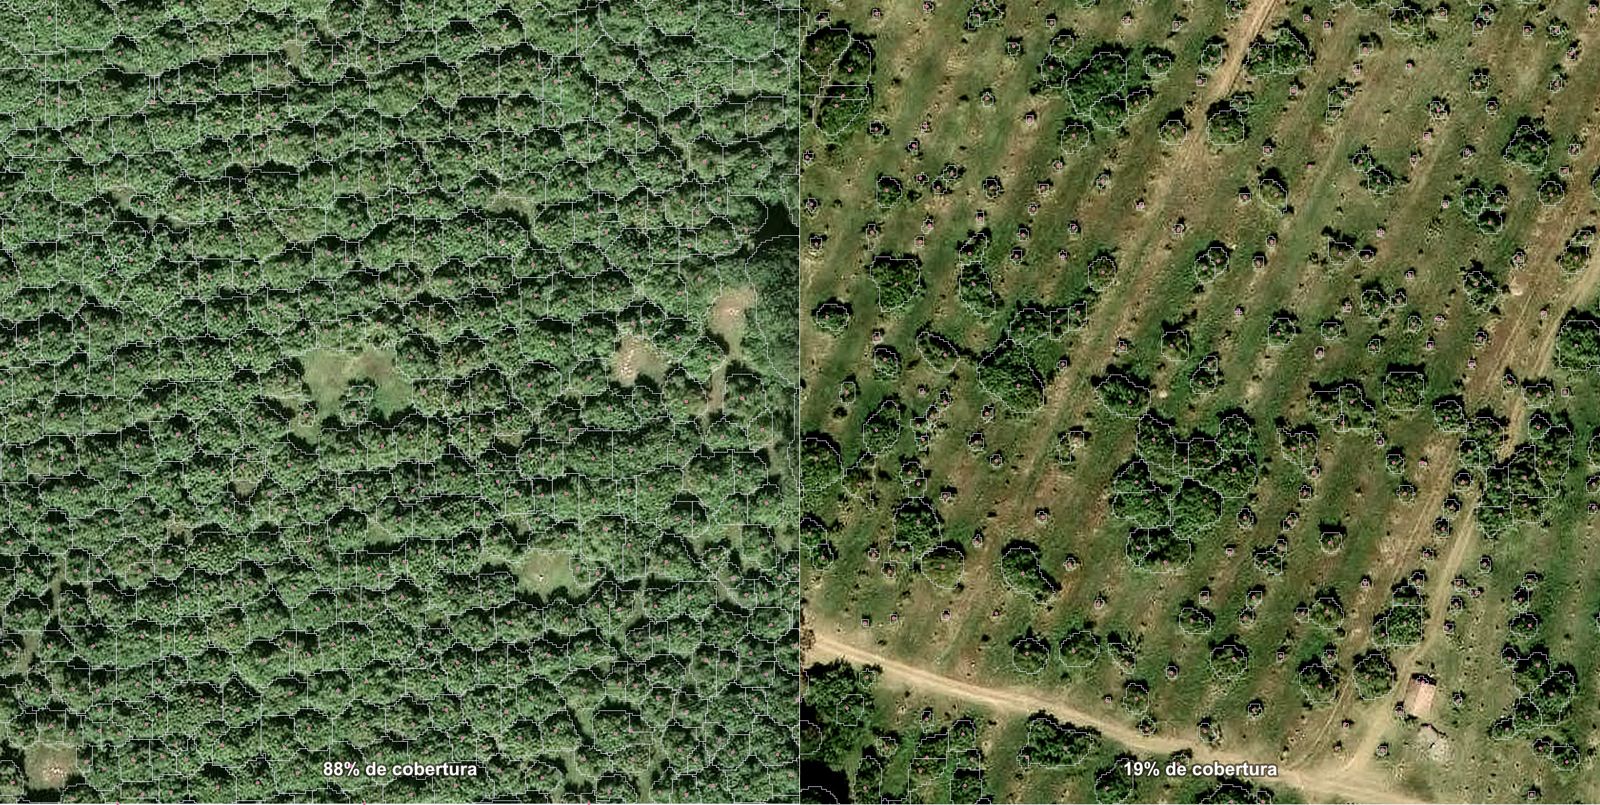
88 % and 19 % cover at the same scale. Left: Amarilla · Coyotera, closed canopy. Right: Sección 2 · Cuesta del Pollo, empty rows and gaps in the grid. Cyan: detected crowns · pink: tree tops.Vivid 30 cm · 2026-02-18
Canopy cover, survey by survey
Trees by stage
Stage by tree height: formation < 3 m · developing 3–6 m · full production > 6 m. Colours match the canopy-height map.
Tree heights
Trees gained and lost
Lots that moved most
Indicative. Cover is turned into yield with the report's Hass response curve (peak at 85 % cover), and trees are grown forward on one growth curve. It frames the order of magnitude and the timing; calibrate it with packing-house records before any valuation.
Path to peak
Where each lot sits on the curve
Yield response to canopy cover, Feb 2026. Dot size is lot area; colour is the lot's action.
Share of peak, by zone
What moves the 2030 yield
Range of outcomes
Where the upside lives
How much to trust each lot's numbers
From the survey's own quality checks: crown fragments (< 5 m²), mixed ages (height CV > 0.5), more trees than the grid allows, and edge effects in small lots. Click a lot.
WHAT THIS SURVEY CANNOT SEE · ◆ NEEDS FIELD OR NEW DATA